The AI Impact Report: Real Results from Real Financial Institutions
Stop reading case studies in isolation. This report brings together seven institutions’ AI deployments—with hard numbers on cost savings, automation rates, and member satisfaction—to show what the data looks like at scale.

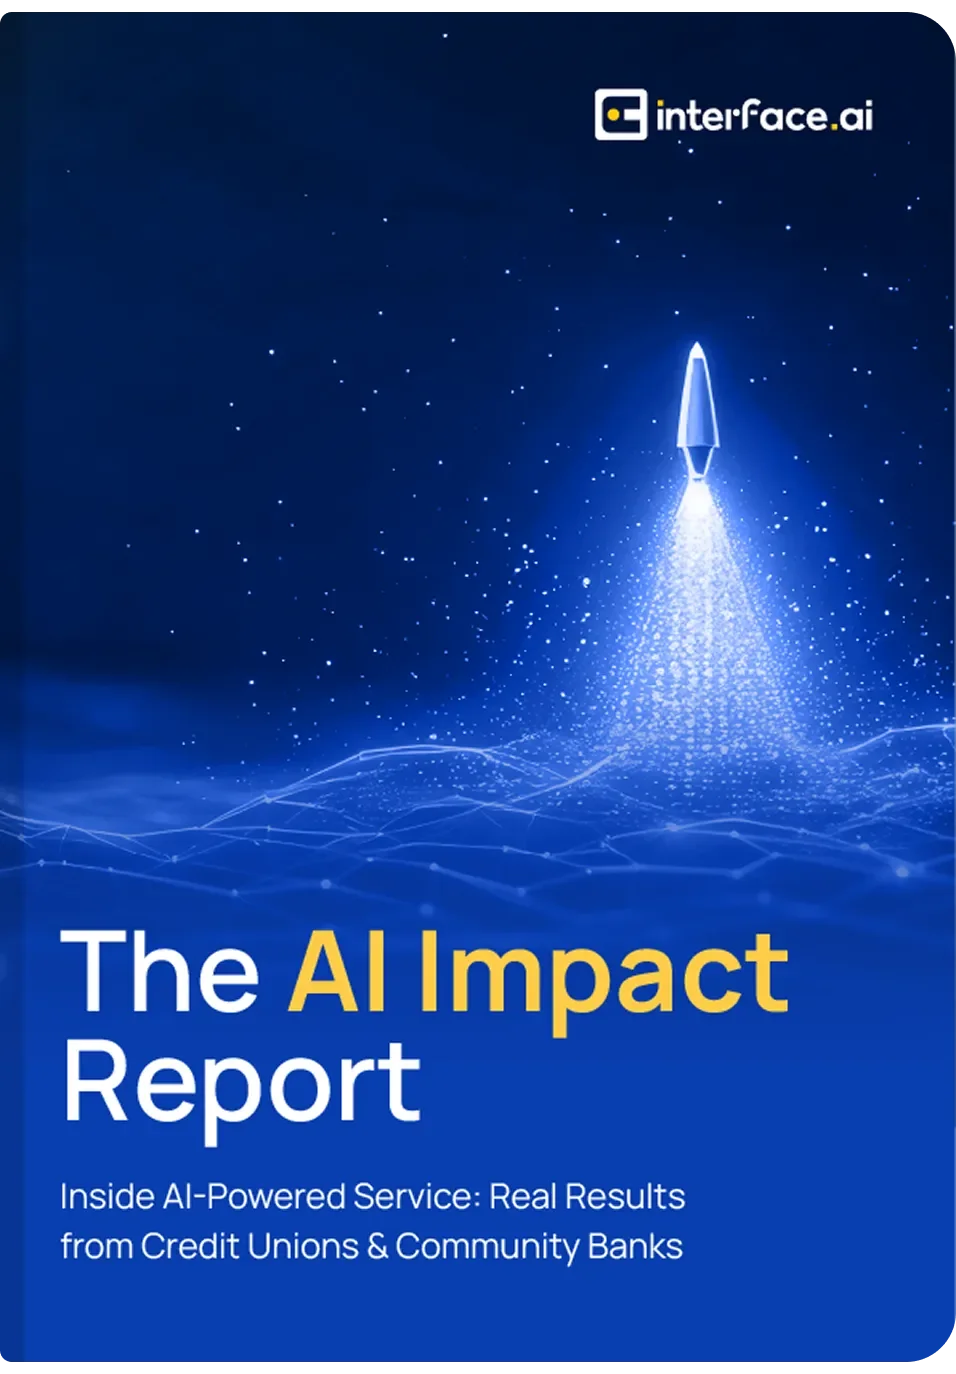
There’s no shortage of AI case studies. There is a shortage of institutions willing to put multiple stories in the same document and let the aggregate data speak. That’s what this report does. Seven credit unions and community banks, representing a range of sizes and deployment types, with real numbers: automation rates, cost per interaction, satisfaction scores, and time-to-value. The variance is real. The patterns are also real—and they tell you what matters most when deploying AI at your institution.
60–80%
Automation rate achieved by Greater Louisville Credit Union with interface.ai
76%
Of all interactions handled by AI at Bank of Guam
$4.4M
In annual savings reported by Neighborhood Credit Union
Written for boards and the people who brief them.
“The numbers don't lie. We went from skeptical about AI to fully convinced within the first six months of seeing what it did for our members.”
interface.ai client featured in the report
Common questions
Are these results typical, or cherry-picked for the best-performing deployments?
The report includes institutions across a range of performance levels—including ones that started slower and built up over time. The goal is an accurate picture, not just the headline wins.
How do results compare between credit unions and community banks?
The report breaks down results by institution type, size, and primary use case—so you can find benchmarks that are relevant to your specific context.
What made the highest-performing institutions different?
The report identifies three predictors of top performance: strong executive sponsorship, a clear automation target set before launch, and willingness to iterate in the first 30 days post-launch.
How long did it take these institutions to see measurable ROI?
Across the seven institutions, average time to measurable ROI was 4.5 months post-launch. The fastest was 90 days; the most complex deployment took 7 months.
Is this data independently verified?
The self-reported metrics were reviewed for consistency by the interface.ai research team. Third-party verification is noted where institutions provided audit data.
Get the Report
More from the Knowledge Center

How AI Powers the Full Lifecycle in Financial Services: Grow, Serve, Retain, Repeat
How AI supports every stage of the member and customer journey - from acquisition to retention.
Read more
The 2025 Credit Union AI Trend Report: What's Rising, What's Fading, and What to Do About It
The trends shaping AI adoption in credit unions - and what leaders should prioritize in the year ahead.
Read more
Credit Union AI Scorecard: Discover Your AI Member Service Maturity
Answer 10 questions and get a personalized readout of where your AI strategy stands and where to focus next.
Read more
The Agentic AI Governance Playbook
Most credit unions and community banks are already running AI agents. Fewer than one in eight have a governance program to match. This playbook gives boards and executive teams the framework, the policy templates, and the 180-day rollout plan to close that gap — before the examiner does.
Read more
Why Agentic AI is Replacing the Collections Queue
How credit unions and community banks are using AI to recover more debt, faster - without adding headcount.
Read more
The ROI of Agentic AI in the Contact Center
A breakdown of the cost savings, efficiency gains, and revenue impact AI delivers in banking contact centers.
Read more